In an effort to provide users with an even more intuitive and streamlined experience, we are excited to unveil the
newly redesigned Homescreen
of AWR. This major update brings forth a fresh and modern interface along with a host of new functionalities and improvements.The new Homescreen serves as an insightful, central dashboard of the application, allowing users to see in a glance
key ranking information
for all the websites they are monitoring with AWR.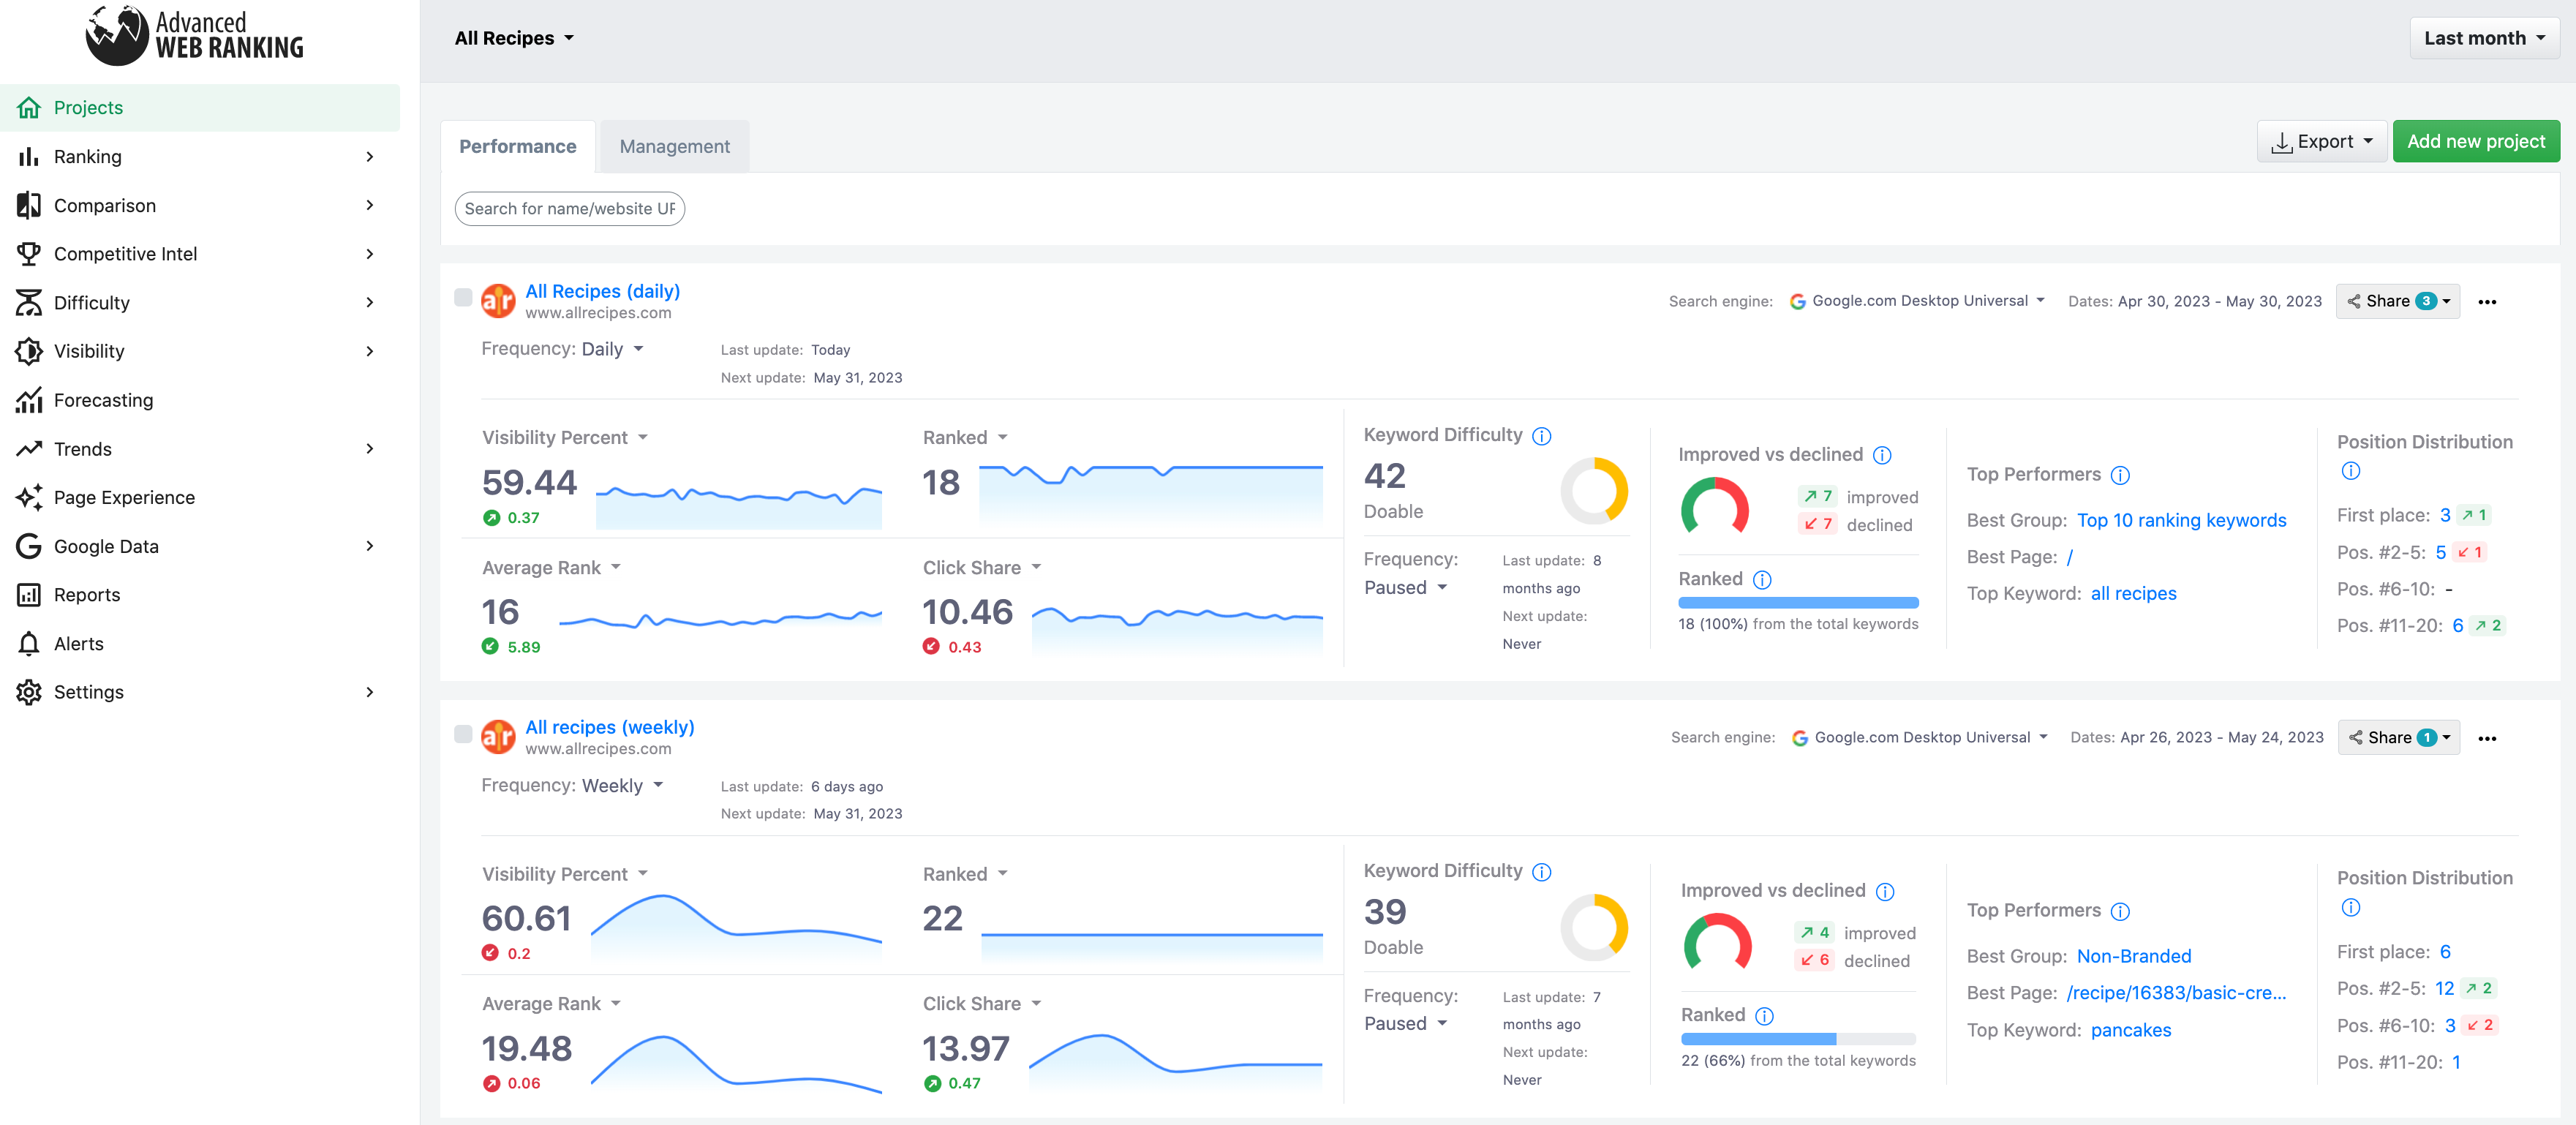
With the redesigned
Performance view
, users can effortlessly monitor their website's performance, gaining valuable insights into their SEO progress and achievements. Additionally, the Management view
provides a wealth of project status updates and essential setup information, making it easier than ever to stay organized and in control.Performance view
As we aimed to deliver an enhanced performance analysis experience to users, a range of new features and improvements have been incorporated into the redesigned Performance view as outlined below:
[New]
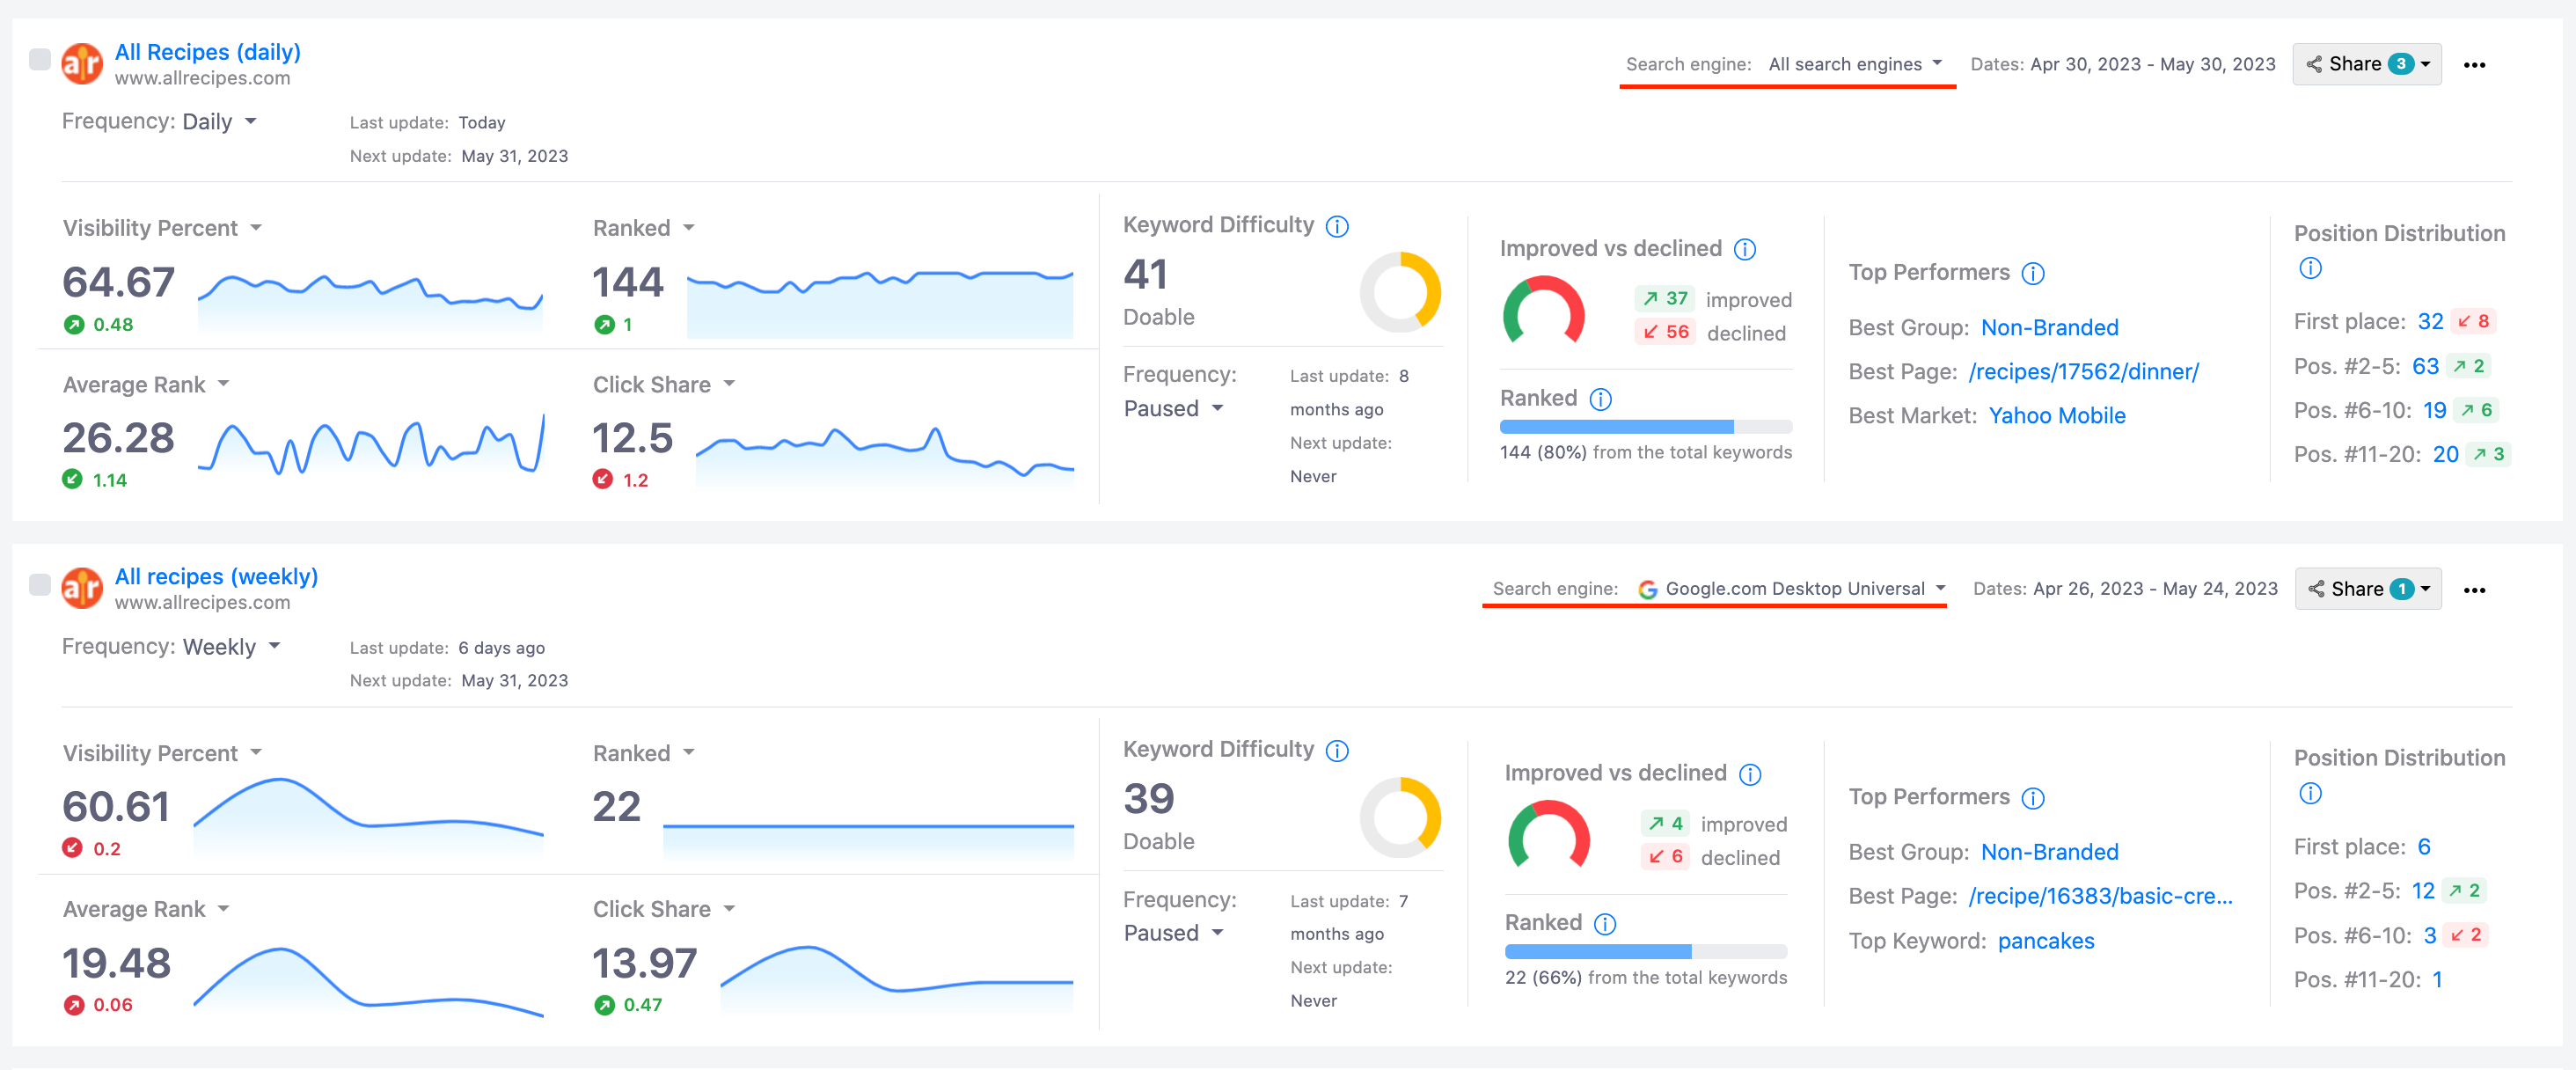
Ranking performance displayed for a specific search engine
The progress in terms of rankings can now be checked for specific search markets, in addition to "all" search engines. The default search engine selection now displays the metrics computed for the first search engine of the project. When a user manually selects a specific market, their preference will be saved for future sessions, and the metrics computed for the manually selected search engine will be shown.
[New]
Top ranking keyword
When a single search engine is selected, the
Top Keyword
metric will be shown as part of the Top Performers KPI. This metric represents the term with the highest Estimated Visits recorded for the main website within the selected time interval.For "all" search engines, same as before, the
Best Market
will still be displayed as one of the Top Performers. The Best Market represents the search engine with the highest Visibility Percent recorded for the main website within the selected time interval.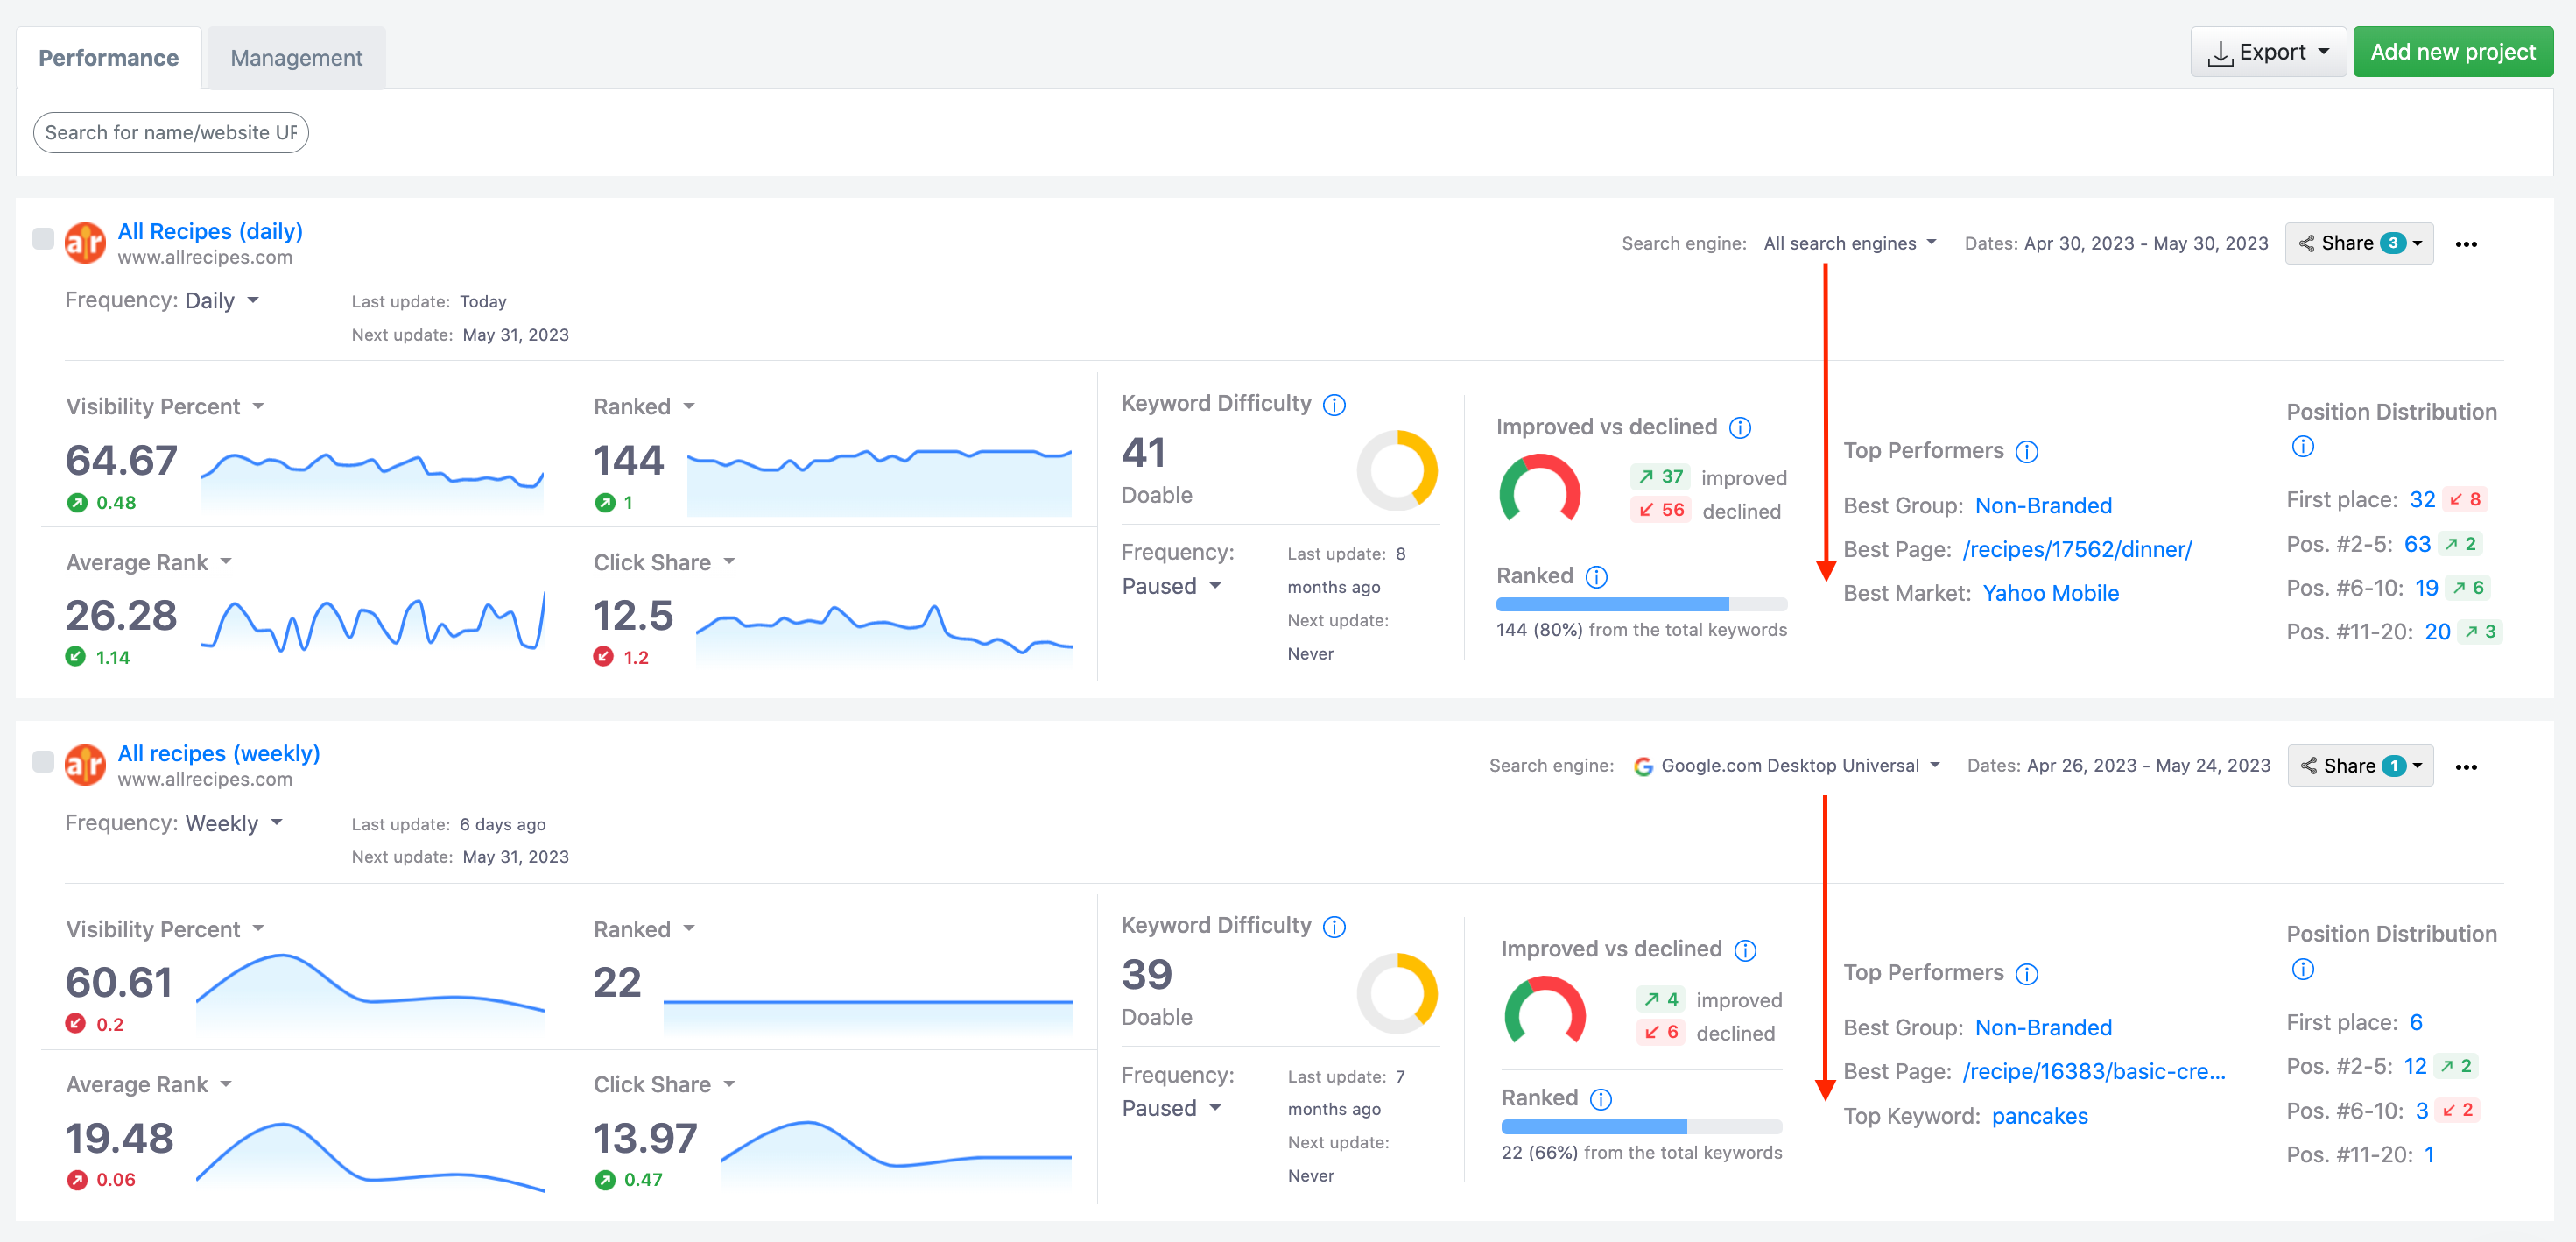
[New]
First place metric added to the Ranking Distribution KPI
The Ranking Distribution KPI, which displays the distribution and changes in top ranking positions, has been enhanced with the addition of the
First place
metric. This metric shows the total number of keywords ranking on position 1
across the selected search engine(s) for the latest update date within the chosen time frame. The changes are calculated by comparing the values recorded on the start and end update dates within the applied time frame.
[New]
Two new performance KPIs
Following the update two new performance KPIs were introduced:
Keyword Difficulty
and Improved vs. declined
.The
Keyword Difficulty KPI
provides insights into the Global Difficulty score of the main tracked website. It takes into account the Domain Difficulty, URL Difficulty, and Content Score of the top 10 ranking results across the selected search engine(s).The
Improved vs. Declined KPI
displays the number of keywords that have experienced an increase or decrease in their position on the selected search engine(s), comparing the start and end update dates within the selected time frame.Additionally, within the Improved vs. Declined KPI, the
Ranked
metric was also introduced. This metric shows the number and percentage of keywords that the main tracked website is ranking for on the selected search engine(s) out of the total number of terms added to the project. This value is calculated for the latest update completed within the applied time frame.
[New]
Default Display: Performance stats for Last month
The default mode for visualizing the ranking data has been updated to display the
Last month
's stats instead of the Last 2 updates
. Furthermore, we have introduced a new time frame option - Last year
- giving one the flexibility to choose between visualizing the data for the Last 2 updates, Last month, Last 3 months, or Last year. This enhancement allows for better customization and analysis of the performance metrics.[Improved]
The calculation method of the KPI metrics has been changed
All metrics within the performance KPIs now reflect the current values, the ones recorded during the latest update. The changes in these metrics are calculated by comparing the values recorded at the start and end update dates within the selected date range. The start and end dates are displayed on the top right of each website card.
Previously, these metrics were calculated as a sum or average across all update dates in the selected interval. Now, the Visibility metrics align with the values reported in the Visibility section.
The exception to this is the Top Performers KPI, for which the calculation method remains the same as before. The top metrics of this KPI are calculated based on the estimated visits recorded across all updates within the selected interval.
Management view
After the redesign, the Management view offers a wealth of information in a more user-friendly interface. In addition to displaying the number of tracked keywords, search engines, and selected search depth for each project, one can easily access the following information:
- Tracked countries and devices
- Status of Google Analytics (GA) and Google Search Console (GSC) syncs
- Resources consumption, differentiating between scheduled and manual updates
- List of assigned team-member users
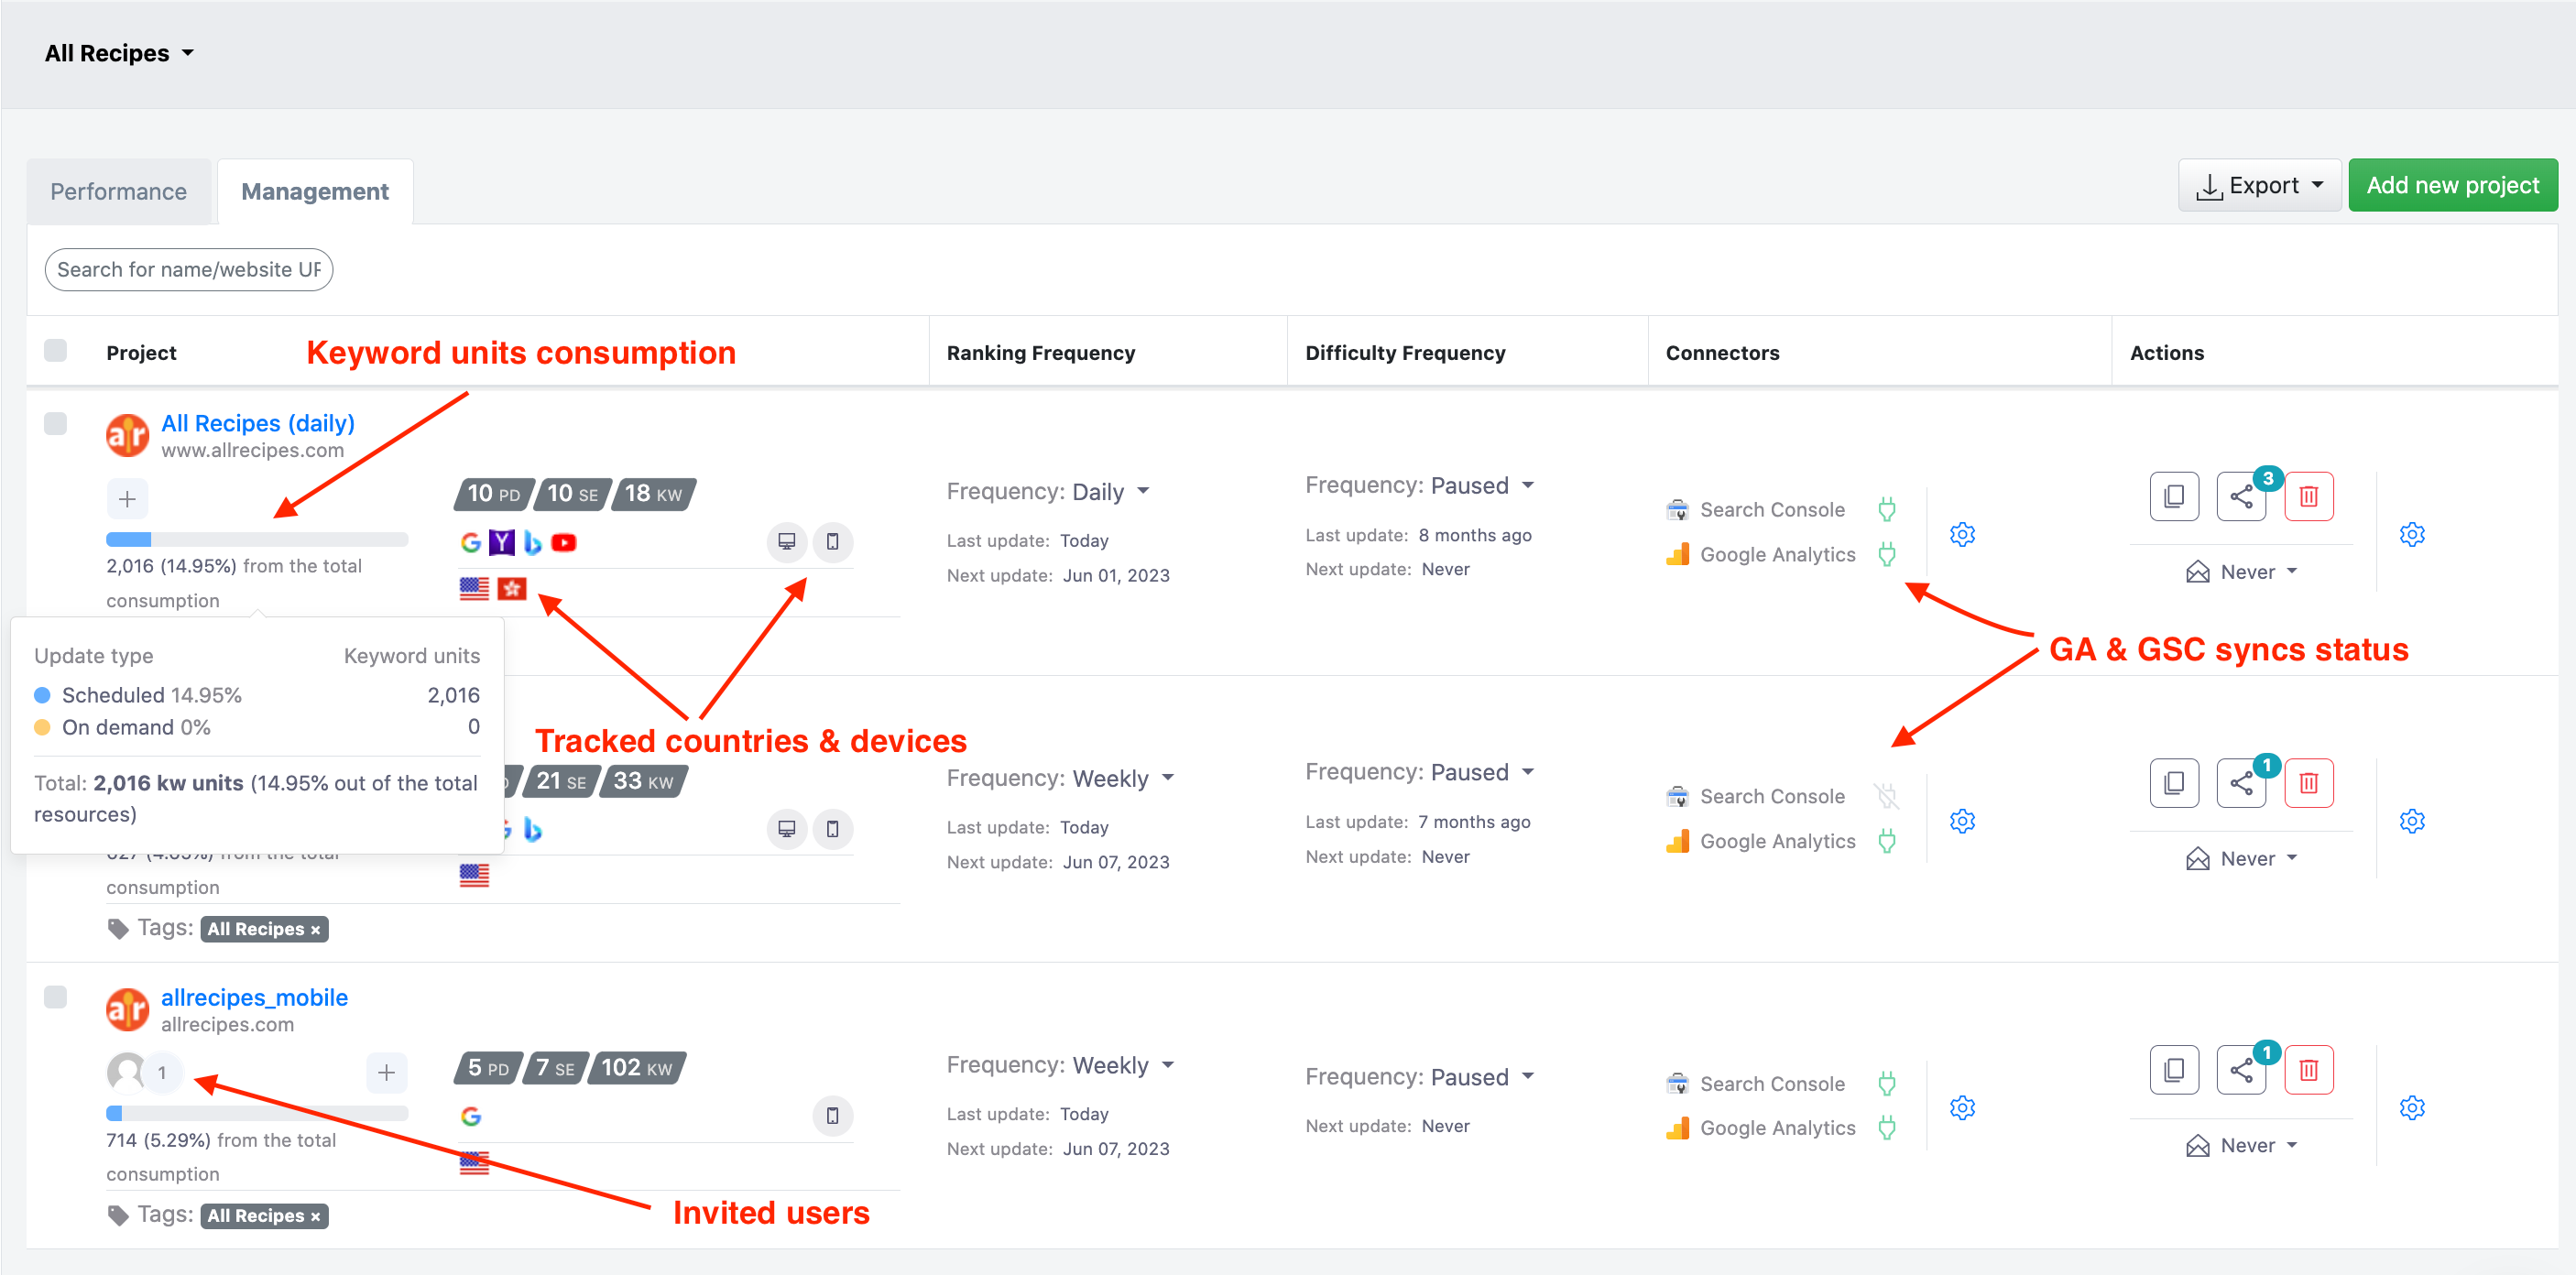
Furthermore, the Management view provides convenient shortcuts to essential features and settings, including:
- Google settings
- Project settings
- User management
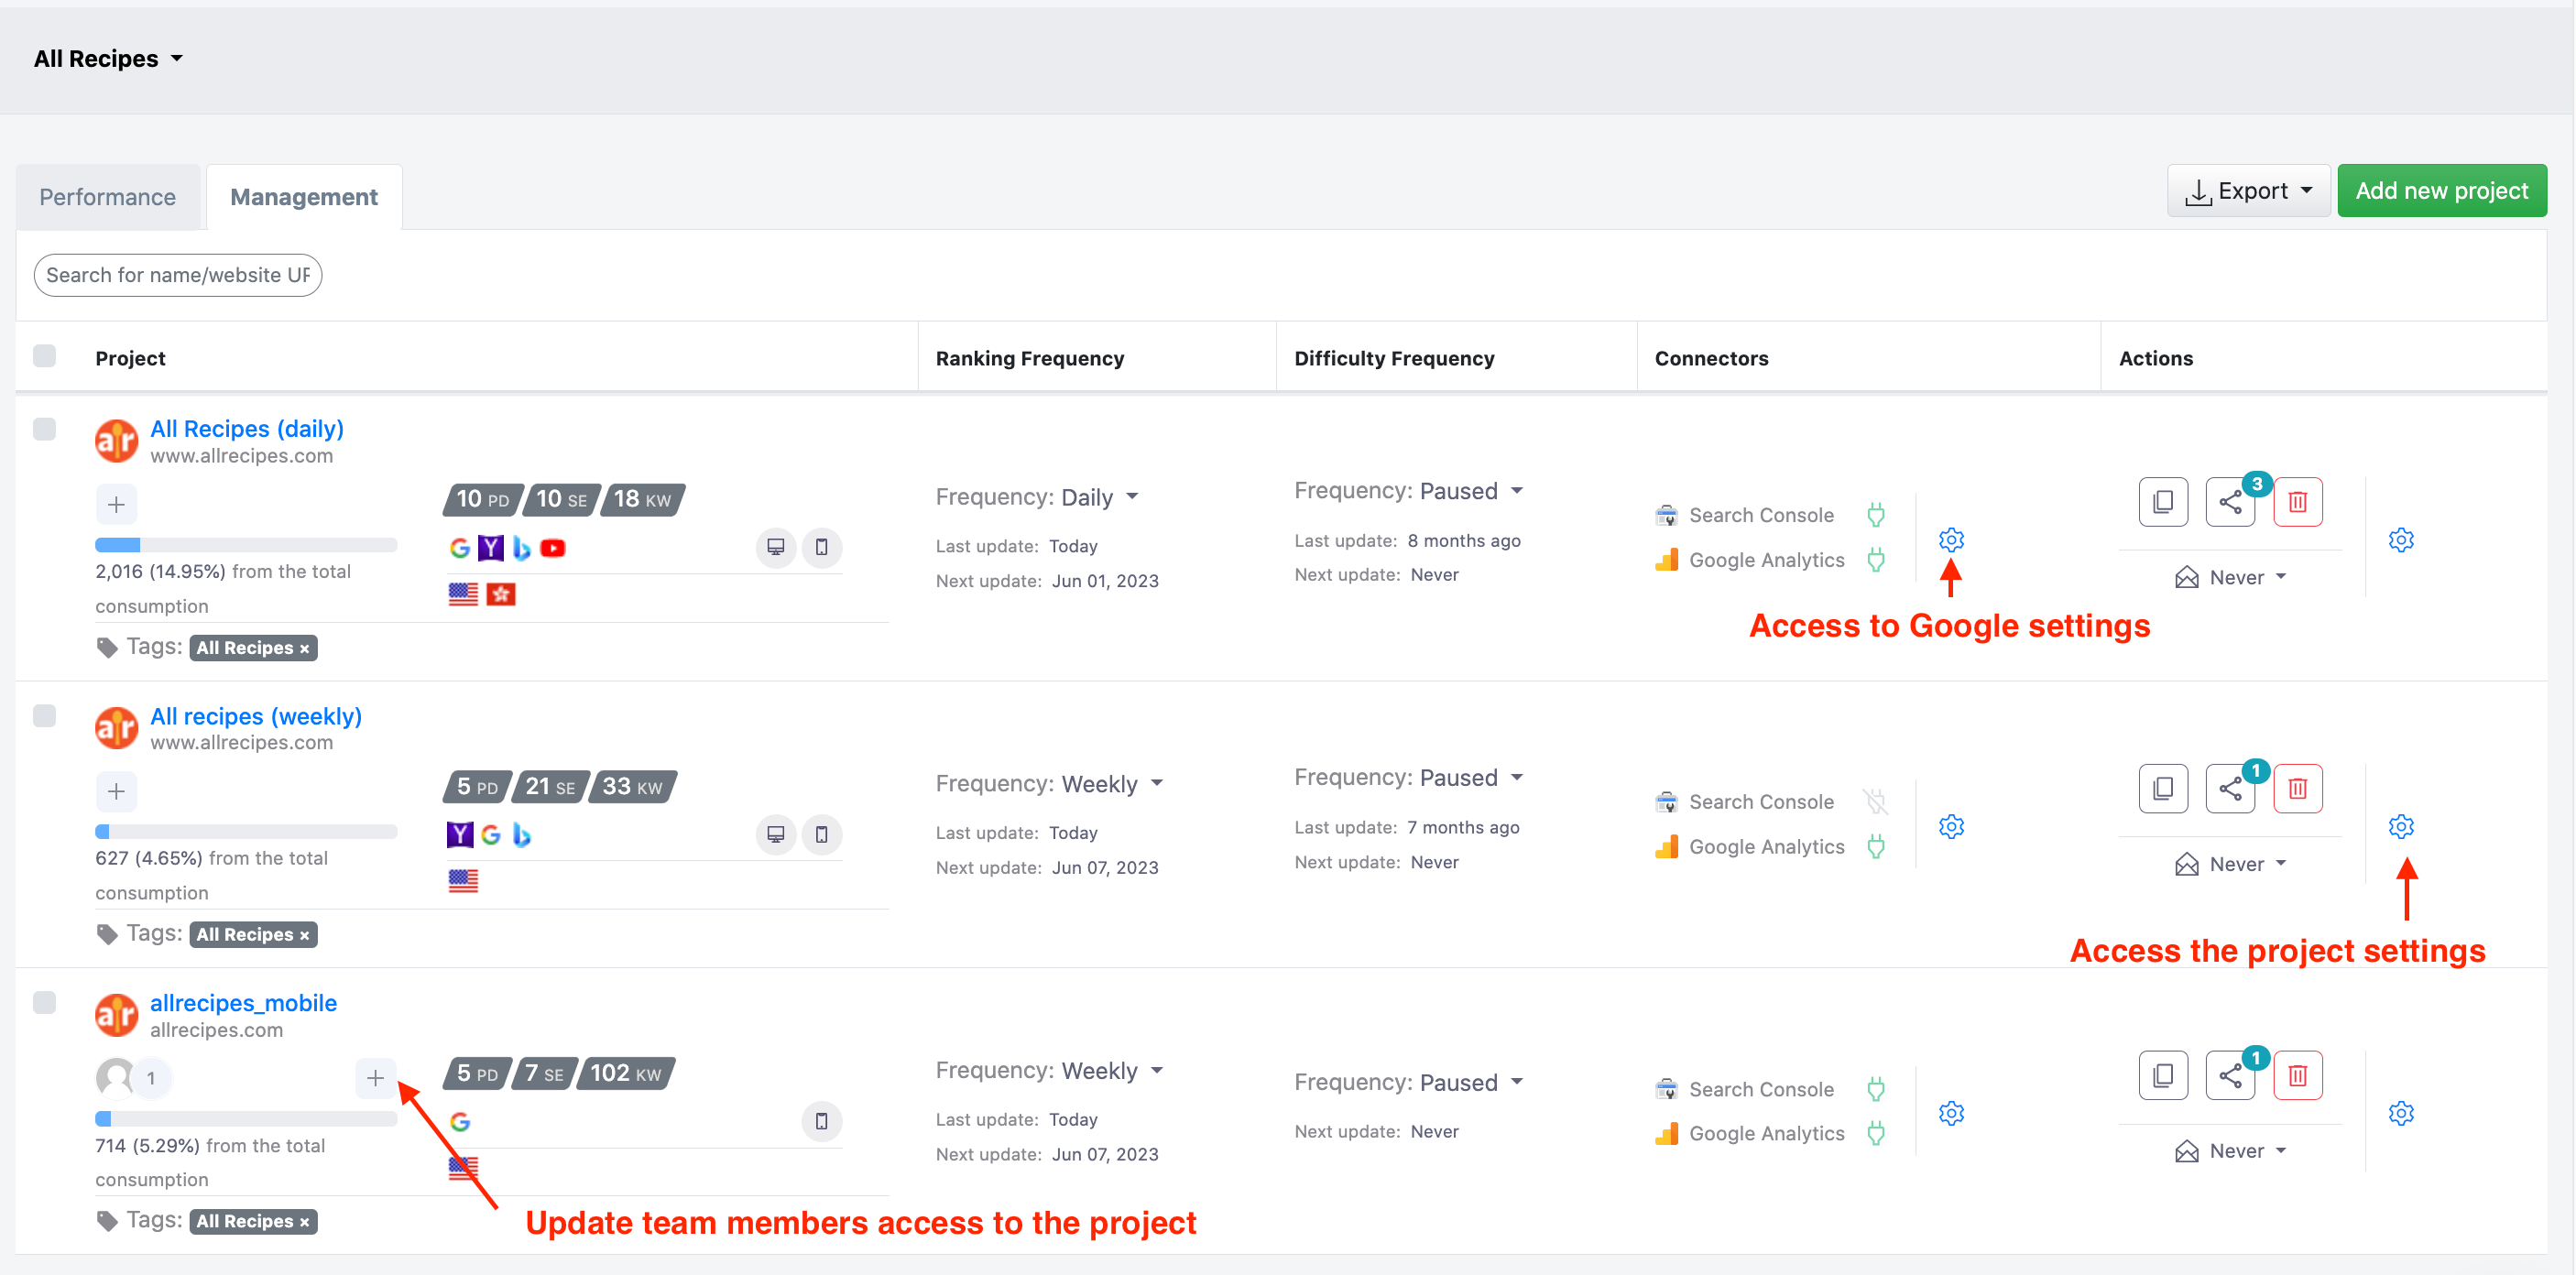
Additionally, one has the ability to perform various actions such as deleting or duplicating a project, adjusting email update frequency, and creating a new shareable link.
With these enhancements, managing AWR projects becomes even more efficient and streamlined.